South Korea's transformation from one of the world's poorest countries to a high-income economy is among the most studied development stories — yet researchers have lacked granular, consistent subnational data spanning the period. MIRACLE fills this gap by digitising, harmonising, and geocoding municipal statistical yearbooks (시군 통계연보) held in Korean national and provincial archives into an annual township-level panel at the 읍·면·동 level.
MIRACLE starts with South Korea's municipal statistical yearbooks, but the ambition extends in two directions. First, within Korea, we plan to incorporate additional administrative sources — expressway construction logs, agricultural extension records, Korea Forest Service archives, colonial-era household registries, and local personnel files — to deepen the panel and enable research designs that link infrastructure, agricultural modernisation, and environmental policy to local institutional conditions.
Second, across countries, the infrastructure we build is designed to accommodate other growth miracle economies with comparable subnational statistical traditions. If similar municipal records exist for Taiwan, or district-level yearbooks for post-war Japan, they belong in the same framework. The goal is a comparative subnational data platform for studying rapid development wherever it has occurred.
Municipal statistical yearbooks (시군 통계연보), published annually by county and city governments. Many survive only as single physical copies in provincial archives, uncatalogued and deteriorating.
From archival pages to analysis-ready panel data in four steps:
AI-OCR for mixed scripts
Custom pipeline fine-tuned for mixed Hangul/Hanja archival tables. 87% pilot accuracy, targeting 92–95%. This is what makes the project feasible — these documents were previously unusable at scale.
Variable harmonisation
Definitions, units, and table structures changed across editions and municipalities. We build crosswalks reconciling these into consistent time series across decades.
Boundary concordances
Two major reorganisations (1963, 1973) plus dozens of smaller changes. We construct time-consistent miracle_id identifiers.
Geocoding & GIS
Every township linked to satellite, elevation, slope, soil, and transport network data. 196 Namhae-gun villages fully geocoded.
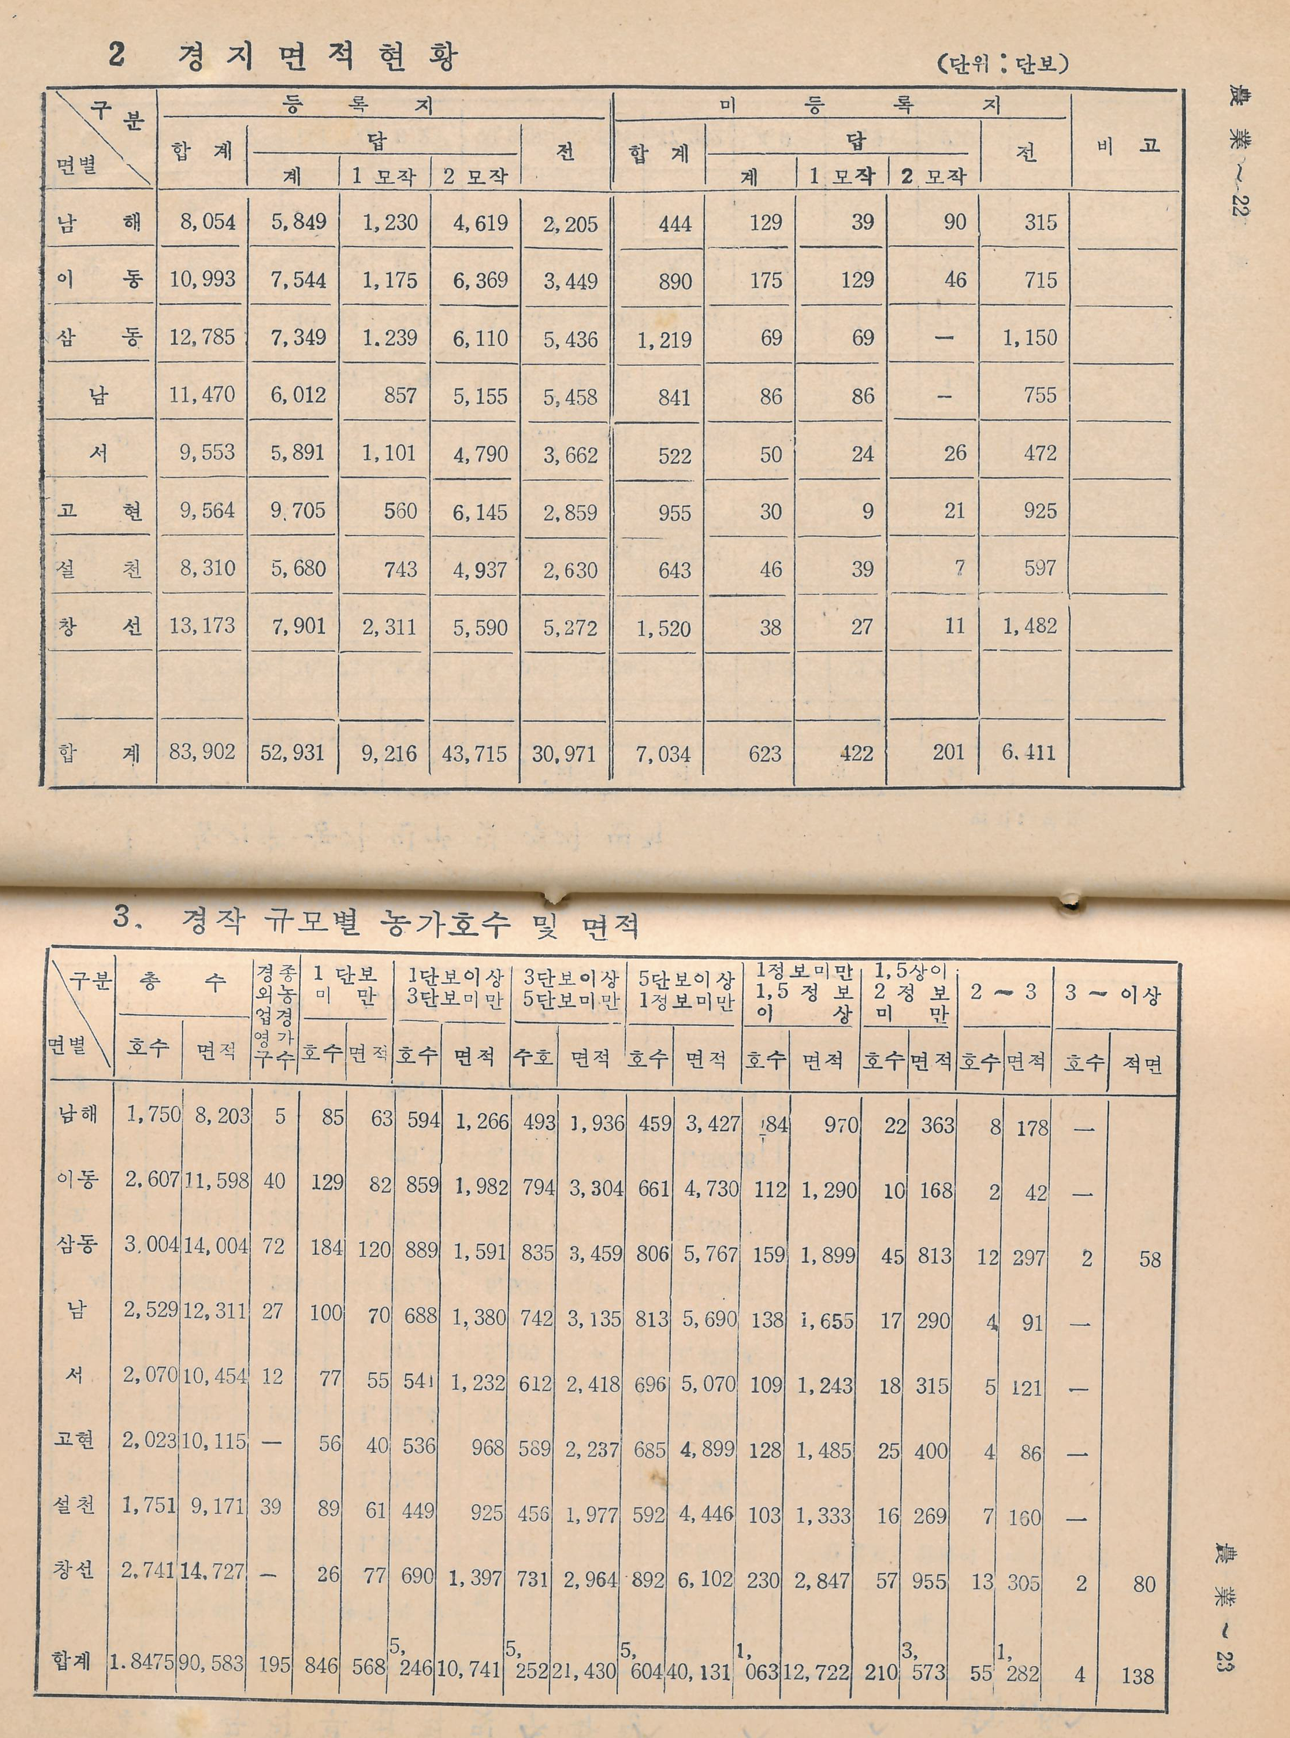
| 읍면 | 합계 | 논 (답) | 밭 (전) | ✓ | ||
|---|---|---|---|---|---|---|
| 소계 | 1모작 | 2모작 | ||||
| 남해 | 8,054 | 5,849 | 1,230 | 4,619 | 2,205 | ✓ balanced |
| 이동 | 10,993 | 7,544 | 1,175 | 6,369 | 3,449 | ✓ balanced |
| 삼동 | 12,785 | 7,349 | 1,239 | 6,110 | 5,436 | ✓ balanced |
| 남면 | 11,470 | 6,012 | 857 | 5,155 | 5,458 | ✓ balanced |
| 고현 | 8,310 | 5,680 | 743 | 4,937 | 2,630 | ✓ balanced |
| 창선 | 13,173 | 7,901 | 2,311 | 5,590 | 5,272 | ✓ balanced |
Each row is a township-year observation linked by miracle_id:
| miracle_id | year | prov | muni | twp | pop | hh | paddy_ha | schools | road_km |
|---|---|---|---|---|---|---|---|---|---|
| KR-48-840-010 | 1970 | 경남 | 남해군 | 남해읍 | 28,412 | 5,680 | 1,245 | 7 | 23.4 |
| KR-48-840-010 | 1975 | 경남 | 남해군 | 남해읍 | 25,891 | 5,320 | 1,198 | 8 | 31.7 |
| KR-48-840-010 | 1980 | 경남 | 남해군 | 남해읍 | 22,105 | 5,010 | 1,152 | 8 | 38.2 |
| KR-47-720-030 | 1970 | 경북 | 영주시 | 풍기읍 | 31,550 | 6,140 | 1,870 | 9 | 18.6 |
Pilot release (Gyeongbu corridor, ~400 townships): late 2026. CSV & Stata.
The full dataset is organised into modules by domain, each a flat panel at the township-year level with consistent miracle_id identifiers. Merge across modules using Core Keys.
| Module | Description | ETA |
|---|---|---|
| Core Keys miracle_id · province · municipality · township · concordances | Geographic identifiers and boundary concordances across the 1963/1973 reorganisations. | 2026 |
| Demographics population · households · age structure | Population counts, household numbers, demographic composition. | 2026 |
| Agriculture paddy area · crop output · livestock | Cultivated area, output (harmonised to metric units), livestock. | 2026 |
| Industry establishments · employment · output | Industrial establishments, manufacturing employment, sectoral output. | 2027 |
| Infrastructure roads · electricity · water · telecom | Road length, electrification, public utilities. | 2027 |
| Public Finance revenues · expenditures · transfers | Municipal revenue/expenditure, central transfers, fiscal capacity. | 2027 |
| Education schools · enrolment · teachers | School counts, enrolment, teachers, educational infrastructure. | 2027 |
| Geospatial shapefiles · centroids · boundaries | GIS boundary files with consistent township geometries. | 2027 |
| Institutions clan concentration · bureaucratic capacity | Pre-treatment institutional measures from 1930 registries and personnel files. | 2028 |
Digitisation proceeds province by province. Hover for details on coverage, years, and scanning status.
Last updated March 2026
MIRACLE enables research designs that were previously impossible — including the first causal analysis of the Gyeongbu Expressway, the Saemaul Undong (R&R, JPE), Korea's high-yield rice revolution, and one of history's largest reforestation programmes. Full research pipeline →
Other applications. Geography of industrialisation, education expansion, fiscal transfers, land reform, environmental policy, developmental states. Using MIRACLE data? Let us know.
BooKang Seol
Changkeun Lee
Hyunjoo Yang
Sogang University
[Name]
[Name]
[Name]
Partners
Questions about the data, collaboration opportunities, or early access — we'd love to hear from you.
[enable JavaScript to see email]Citation
@techreport{seol2026miracle,
  author    = {Seol, BooKang and Lee, Changkeun and Yang, Hyunjoo},
  title     = {Project {MIRACLE}: Subnational Economic Data for
               South Korea's Developmental Period, 1960--1989},
  institution = {London School of Economics},
  year      = {2026}
}